Shopping Smarter with Mobile Devices Changes the Face of Holiday Shopping
Mobile Makes Its Mark on Thanksgiving, Black Friday, and Cyber Monday Sales in 2012
How does consumers’ use of mobile devices change the way they shop? The detailed shopping statistics from the five-day kick-off of the 2012 holiday shopping season gives us some clues. “Couch Commerce” was popular on Thanksgiving, as friends and family passed computer tablets around. Price comparisons on mobile apps helped in-store shoppers find the best deals. On CyberMonday, power shoppers used laptops and tablets more than phones to grab deals.
NETTING IT OUT
In the U.S., the Thanksgiving holiday weekend has become a huge shopping occasion. The Friday after Thanksgiving is known as Black Friday, because sales on that day can help ensure that retailers stay in the black. For the past few years, the Monday after the long weekend has been dubbed Cyber Monday because it has become the biggest day for online shopping. This year was no exception. The long Thanksgiving weekend was huge in terms of retail sales.
But what was different in 2012, compared to previous years, were two things:
- 52% of the shopping over the five-days was done online.
- Depending on whose numbers you believe, between18% and 30% of that online shopping was done using mobile handheld devices.
Now, retailers are referring to Thanksgiving as “Tablet Day;” Black Friday Shoppers are m-commerce empowered; and Cyber Monday has become Cyber Week.
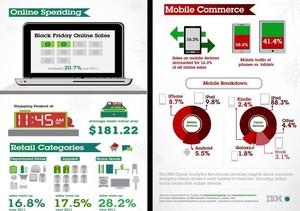
IBM’s InfoGraphic for Black Friday 2012
(Click on image to enlarge.)
© 2012 IBM
1. IBM published a Digital Analytics Benchmark for Black Friday 2012 (e.g. Friday, November 23, 2012, the shopping day after Thanksgiving). This report analyzed online shopping and mobile shopping in three categories of spending: apparel (, department stores, health & beauty, and home goods for the time period between midnight on Thursday, November 22nd and midnight Friday, November 23rd. The report indicates that 2012 online sales increased considerably when compared to 2011 online sales: a 28.2% increase for home goods; a 17.5% increase in apparel, and a 16.8% increase in department store sales compared to 2011. IBM also stresses the role that mobile commerce played. Sales on mobile devices accounted for 16.3% of all online sales. The iPad was the most frequently used mobile device for “couch commerce.” Mobile devices were used in stores as well as instead of stores. 58.6% of mobile traffic to online sites was from mobile phones, compared to 41.4% for tablets.
U.S. RETAIL TRENDS 2012: THANKSGIVING, BLACK FRIDAY, & CYBER MONDAY
Consumer Holiday Shopping: Economic Indicator?
In the U.S., as in many other countries, tracking consumer shopping patterns for the biggest shopping season of the year—the Christmas shopping season—is a major pastime. In a period of deep economic recession, whether or not consumers spend money on gifts is thought to be an important indicator of consumer confidence.
Yet, in my opinion, given Americans’ addiction to credit cards, holiday shopping may be more of an indicator of how deeply-rooted consumerism is in our culture than it is a sign of consumer optimism. Americans are still a “shop till you drop” breed. This obsession with buying things continues despite the fact that there’s a new war in the Middle East, and that climate change is having devastating effects on peoples’ lives and livelihoods (Hurricane Sandy, record droughts, floods, etc.), and that unemployment and underemployment are at all-time highs, and our politicians are about to pull us over a fiscal cliff which may lead to global financial collapse.
The National Retail Federation, which has tracked spending in the U.S. for the seasonal holidays for decades, was forecasting as of October 2012 that holiday sales would increase 4.1 percent to $586.1 billion this year. NRF defines “holiday sales” as all U.S. retail sales in November and December EXCEPT sales from car dealerships, gas stations, and restaurants. This year’s forecast is less than the 5.6 percent growth in 2011 holiday sales, but greater than the 10-year average increase of 3.5 percent per year.
As of Sunday, November 27, 2012, the NRF reported that they expected $59 billion of total spending for the weekend, which would be an increase of 12.8 percent over the same extended Thanksgiving weekend in 2011. That’s 10% of the total anticipated total holiday sales. One bit of other good news is that almost two thirds of consumers told the NRF’s consumer research arm that were going to pay with cash or debit cards. In other words, American consumers were planning to avoid going into debt and accumulating higher balances on their credit cards. They planned to spend the money they have and look for value, which NRF’s CEO Matthew Shay defines as: price + quality + convenience. He also said that consumers were doing a lot of price comparisons.
HOLIDAY SHOPPING PATTERNS TELL US HOW CONSUMERS LIKE TO SHOP FOR GIFTS FOR OTHERS (AND THEMSELVES)
Not all holiday shopping is shopping for gifts. The bargains lure many people who have been saving up for some major household item to take advantage of the holiday sales. Large screen TVs are not gifts. They’re for the family. The same is true for household appliances. Clothing is another category where people are often buying for themselves, rather than for gifts. Note that the biggest categories of spending over the Thanksgiving weekend were home goods and apparel.
Social Shopping & Solo Shopping
What interests me the most in pouring through the statistics are the ways in which consumer behavior are changing and the speed with which retailers are adapting to those changes. Here are the patterns I noticed...
Sign in to download the full article
0 comments
Be the first one to comment.


